The best protein-ligand interaction visualization tools include PyMOL, BIOVIA Discovery Studio, and Schrödinger Maestro on the desktop, plus Nanome for interactive 3D and XR inspection. Nanome is a collaborative molecular visualization and drug discovery platform that runs in the browser and on XR headsets, so you can walk around a binding pocket in real 3D. MARA, the AI copilot inside it, computes the actual interactions on request. The right pick depends on whether you want a publication figure, a full comp-chem workflow, or a hands-on look at how a ligand sits in its pocket.
What these tools show you
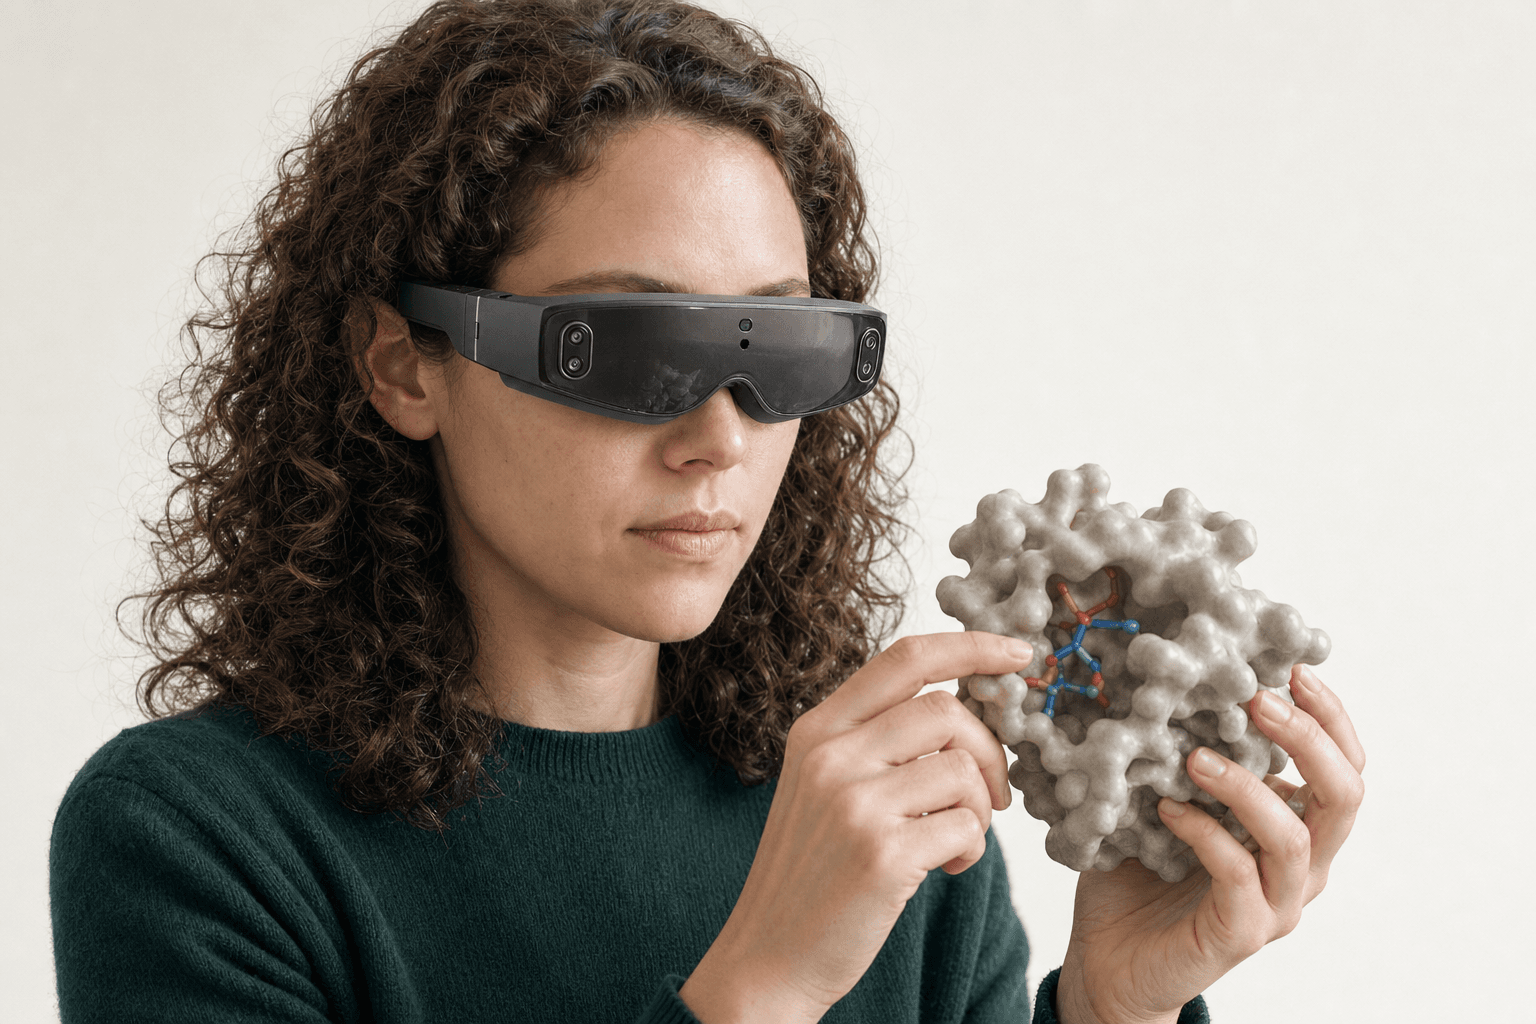 A researcher wearing an ultra-thin VR headset studies a solid protein surface model with a small ligand visible in its binding pocket held close to the chest
A protein-ligand interaction map turns a pile of atoms into the specific contacts that make a ligand bind. The ones worth reading:
- Hydrogen bonds: donor and acceptor pairs, usually drawn as dashed lines with distances in angstroms.
- Hydrophobic contacts: where greasy parts of the ligand tuck against nonpolar residues.
- Pi-stacking: aromatic rings stacking face-to-face or edge-to-face, common with tryptophan, phenylalanine, tyrosine, and histidine.
- Salt bridges and electrostatics: charged groups pulling on each other.
- Steric clashes: atoms sitting too close, a red flag on a docked or predicted pose.
A good tool labels these, measures them, and lets you toggle each type so the picture doesn't turn to spaghetti.
Contact reading is one narrow job a viewer does, and the wider survey of what's out there sits in the best molecular visualization tools.
Where each tool fits
| Tool | Its strength | How Nanome sits next to it |
|---|---|---|
| PyMOL | Rendered figures for manuscripts, scripted from Python, cited across the literature | Nanome opens the saved .pse session so a pocket becomes something two people can walk into together |
| BIOVIA Discovery Studio | Desktop suite with 2D interaction diagrams and contact tables | MARA redraws those same contacts in 3D on request and names the routine that produced them |
| Schrödinger Maestro | Docking, free energy, ligand prep, validated end to end | Nanome connects to Schrödinger LiveDesign, so a pose crosses over instead of being rebuilt |
PyMOL is where most published figures come from. It's precise, it scripts cleanly, and almost anyone in the field can open a session someone sends them. Nanome reads those .pse files directly, though a session carrying QM/MM link atoms can trip the parser.
Discovery Studio and Maestro are heavier suites covering the whole pipeline, prep through scoring, with contact analysis built in. Structures cross into Nanome as Maestro .mae and .maegz (the pair LiveDesign hands off), and the everyday structure formats load too, PDB and mmCIF through SDF, MOL2, XYZ and PQR, with .pdbqt added in 2.6.0. More on supported formats.
Any of those three is the better answer when the deliverable is a particular rendering, a validated docking protocol, or a 2D contact diagram for a report. They're mature and they're accurate. Where the interaction read sits inside a wider computational stack is mapped out in drug discovery software for computational chemistry.
Where Nanome is different
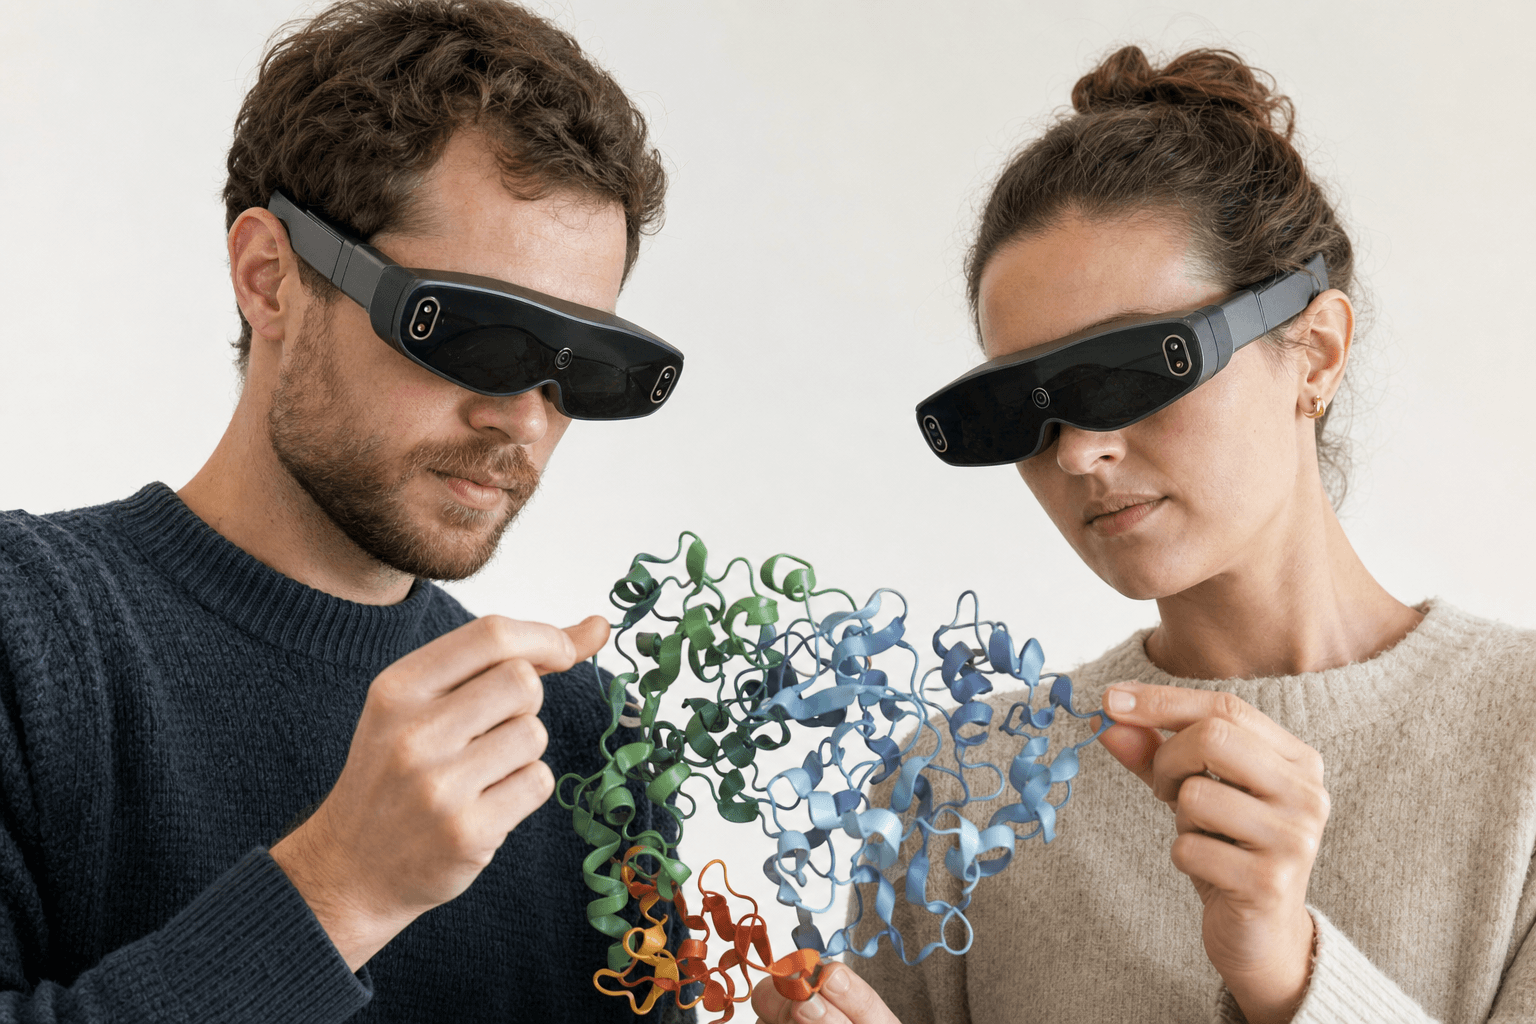 Two colleagues wearing ultra-thin VR headsets examine the same ribbon-cartoon protein structure floating between them
Nanome puts you inside the structure. You load a PDB or SDF file, or fetch a code from RCSB PDB, PubChem or DrugBank, and the pocket turns into something you can lean into and rotate with your hands on an Apple Vision Pro, Meta Quest, Pico Neo, HTC Vive Focus 3, a Windows desktop, or the browser web app with no headset.
Nimbus Therapeutics changed a decision on the strength of that view. The team was evaluating the AMPKβ2 enzyme and had settled on a selectivity strategy. Seeing the protein flex in VR surfaced a better synthetic vector, and they redirected the chemistry. Their summary of the outcome: "We were able to make our compounds more active on the target."
MARA is what changes the mechanics of inspecting a contact. Ask in plain English for a report of the contacts between a ligand and its protein, and it picks the routine, draws the hydrogen bonds, hydrophobic contacts and pi-stacking, and records which routine it called and on what. The same session goes further when the question does: docking, electrostatics through APBS, ADMET prediction, or a co-fold on Boltz-2, one of several engines it can call for that job. MARA's built-in library runs to 300+ tools across 26 categories.
The same reading applies at an antibody-antigen interface, where the contacts sit between a CDR loop and its epitope. That lane gets its own treatment in software for computational antibody design.
Two people can stand in the same pocket at once. Real-time multiplayer puts a chemist and a structural biologist on the same clash, on the same atoms, working it out while both are still looking at it.
When another tool is the right call
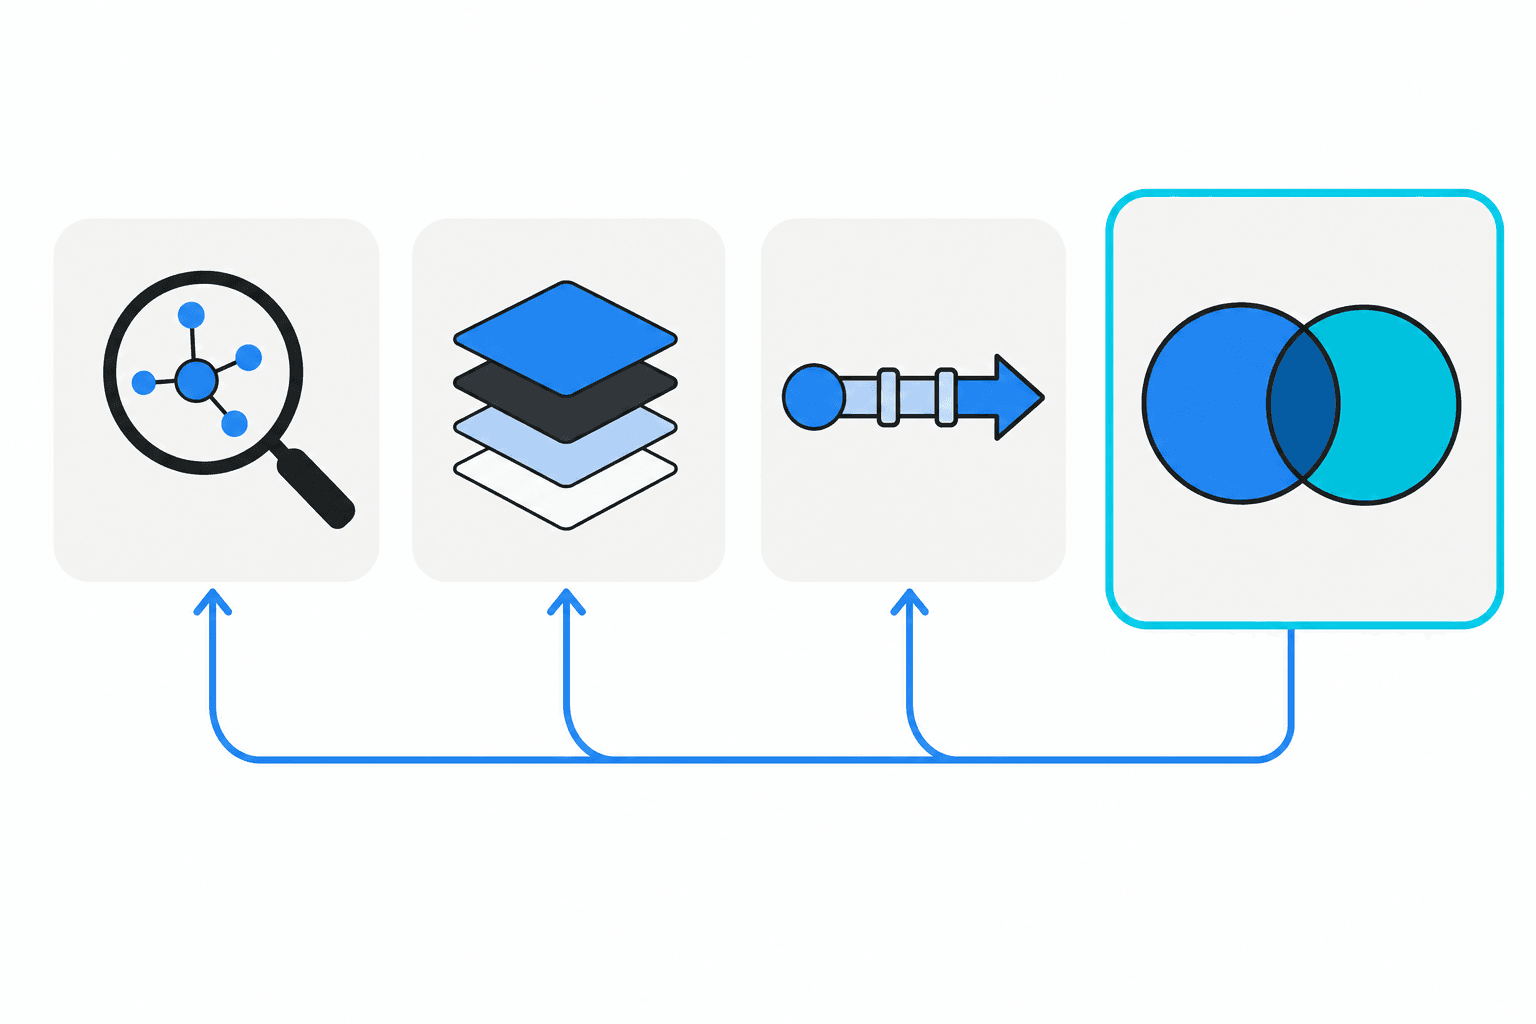 A flat vector diagram showing four tool icons connected by arrows, with the collaborative inspection hub linked back to each specialized tool to illustrate integration rather than replacement.
For a static, pixel-perfect figure headed into a manuscript, PyMOL remains the right answer. For work that already lives inside a validated Schrödinger or Discovery Studio pipeline, scoring and prep belong where they are. Nanome connects to Schrödinger LiveDesign, OpenEye, Cresset Flare and CDD Vault, so it takes a seat beside those tools rather than asking anyone to give them up.
Nanome is the pick for turning a pose over in true 3D, catching a clash that a flat projection hides, or bringing a collaborator into the pocket alongside you. Projects that worked that way are written up in the case studies.
FAQ
What is the best tool for visualizing protein-ligand interactions?
For a figure in a paper, PyMOL. For a full comp-chem suite, Schrödinger Maestro or BIOVIA Discovery Studio. For interactive 3D and XR inspection with MARA computing the hydrogen bonds, hydrophobic contacts and pi-stacking, Nanome. Most groups run more than 1 of these, and Nanome connects to several.
Can Nanome show hydrogen bonds and pi-stacking?
Yes. Ask MARA for the interactions between a ligand and its protein and it draws hydrogen bonds, hydrophobic contacts and pi-stacking, flags steric clashes, and names the routine behind the result along with what it was given.
What file formats does Nanome open?
Formats that import and stay editable: SDF (.sdf, .sd), PDB (.pdb, .ent), mmCIF (.cif, .mmcif, .mcif, .bcif), MOL and MOL2, XYZ, PQR, plus SMILES typed in directly. Formats that import for viewing: PDBQT, which converts to PDB with charges dropped, Maestro .mae and .maegz, MOE .moe, and PyMOL .pse. What comes back out is one frame as PDB, SDF or SMILES, so mmCIF, MAE, MOE and PSE travel one way in. The full table lives in the supported formats reference.
Does Nanome need a VR headset?
No. It runs in a browser web app with nothing to install, and there's a Windows desktop build. Meta Quest and Apple Vision Pro add the hands-on version of the same session.
Does Nanome replace PyMOL or Schrödinger?
No, it works next to them. Nanome reads the files those suites already write and links up with Schrödinger LiveDesign, OpenEye, Cresset Flare and CDD Vault, so a pose and its data travel across rather than getting rebuilt.