To analyze protein-ligand interactions, load the complex into Nanome, turn on interaction lines, and read the hydrogen bonds, hydrophobic contacts, and pi-stacking directly on the 3D structure. Nanome is a collaborative molecular visualization and drug discovery platform that runs in a browser, on Windows desktop, and in XR headsets, and its AI copilot MARA can compute a full interactions report for you. You get the geometry in front of you and the numbers alongside it.
The short version: you're looking at how a small molecule sits in a binding pocket, and which specific atoms hold it there.
What to look for
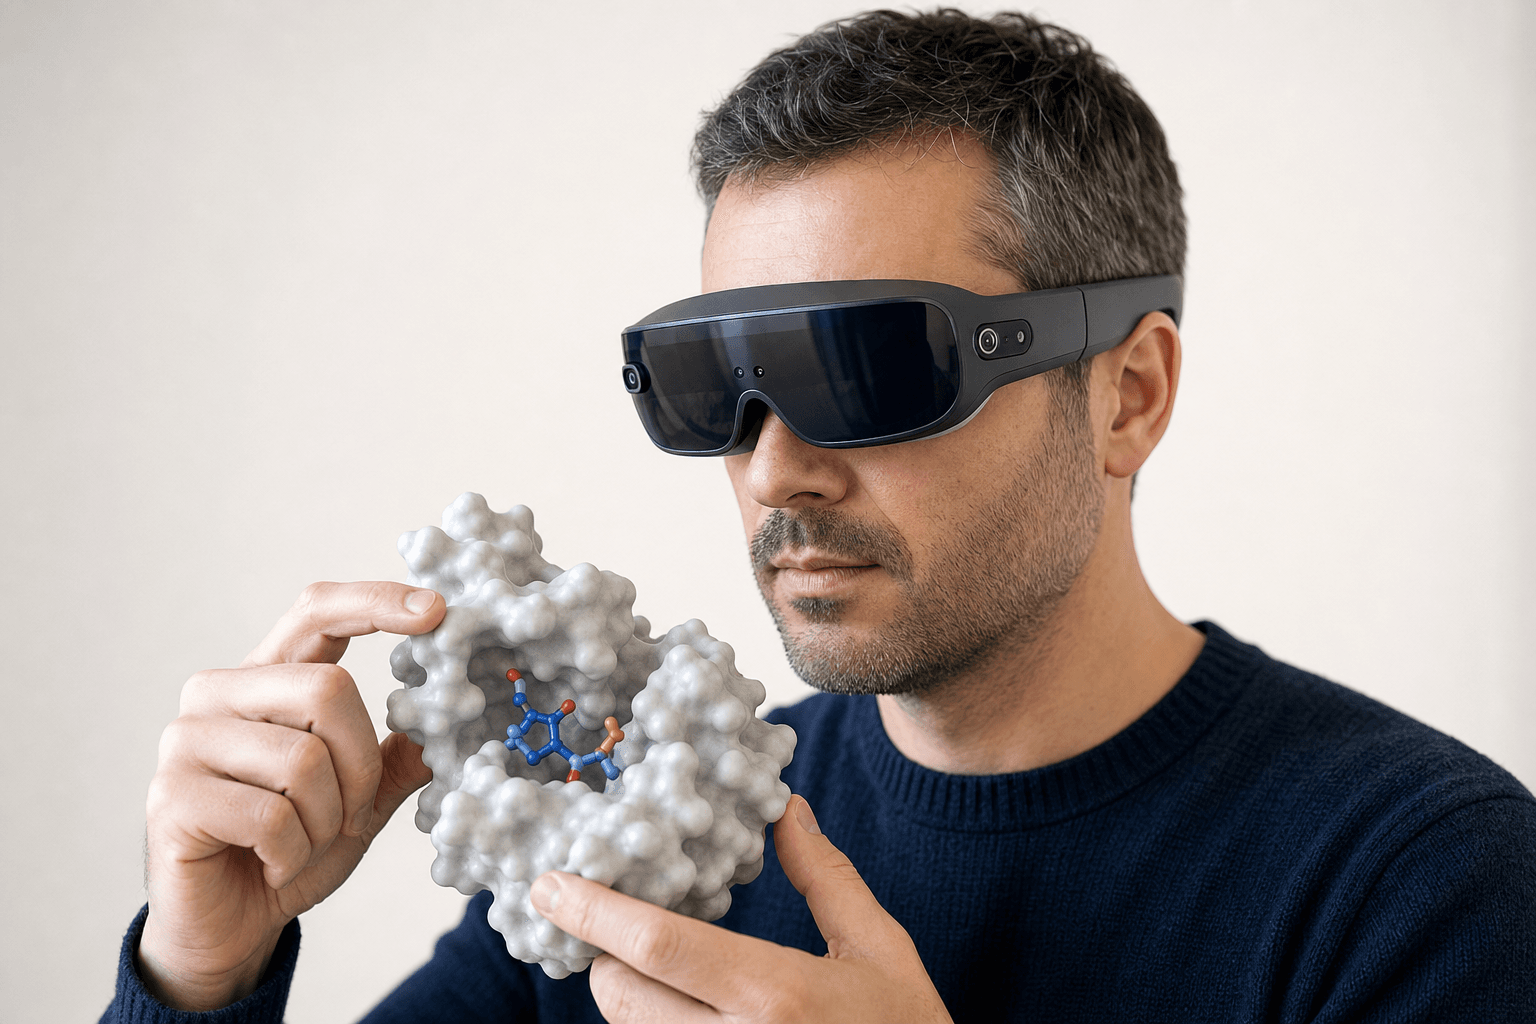 A researcher wearing an ultra-thin VR headset studies a solid protein surface model with a small ligand visible in its binding pocket held close to the chest
An interaction analysis comes down to a handful of contact types. Each one tells you something different about why the ligand binds and how tightly.
| Interaction type | What it means | Why it matters |
|---|---|---|
| Hydrogen bonds | A donor and an acceptor atom sharing a hydrogen, usually 2.5 to 3.5 angstroms apart | The main directional anchor. Miss one and affinity can drop hard. |
| Hydrophobic contacts | Nonpolar surfaces of the ligand tucked against nonpolar residues | Cheap, forgiving binding energy. Fills the pocket. |
| Pi-stacking | Aromatic rings stacking face-to-face or edge-to-face | Common with aromatic drugs against Phe, Tyr, Trp, His |
| Salt bridges | A charged group on the ligand paired with an oppositely charged residue | Strong, but sensitive to pH and solvent |
| Steric clashes | Atoms sitting closer than their radii allow | A red flag. Often means a bad pose or a strain you'll pay for. |
Hydrogen bonds are usually the first check, and they're also the easiest to miss if the file arrived without hydrogens in it.
How to see hydrogen bonds in a protein-ligand complex
Here's the workflow in Nanome, start to finish.
- Load the complex. Open a PDB or SDF file, or fetch a structure by ID from RCSB PDB, DrugBank or PubChem without leaving the app. If the protein and the ligand sit in separate files, load both. The wider tour of getting a structure on screen is in how to view PDB files in 3D.
- Find the ligand. Select the small molecule and zoom to it. The binding pocket is whatever wraps around it.
- Add hydrogens. Hydrogen bonds need hydrogens to be defined. Most crystal structures arrive without them, so protonate first and the donors and acceptors become real atoms rather than inferences.
- Turn on interactions. Switch on interaction lines. Nanome draws hydrogen bonds, hydrophobic contacts, and pi-stacking as colored dashes between the ligand and nearby residues, right on the structure.
- Inspect in 3D. Rotate the pocket. In a browser you do this with the mouse; in a headset you reach out and grab it. Seeing a hydrogen bond from the side tells you whether the angle is any good, which a head-on view flattens away.
- Label the residues. Show residue names on the contacts, so you can tell whether Asp189 is holding that amine or whether the contact runs to a backbone carbonyl you can't act on.
That's the visual pass. The quantitative side goes to MARA.
Letting MARA compute the report
 A flat vector diagram showing a speech bubble on the left connected by an arrow to a structured analysis report on the right, representing plain-English input driving a computational output.
The same job goes to MARA in one sentence. Ask Nanome's copilot to analyze the interactions in your complex and it runs the tools, then hands back a report: the hydrogen bonds with their distances, the hydrophobic contacts, the pi-stacking pairs, and the residues doing the work.
The report names every tool it called, the inputs it passed in, and what each one returned, so a reviewer can audit the run rather than take a number on faith. Interaction analysis is one small corner of what MARA reaches. The same copilot fires docking, electrostatics with APBS, ADMET prediction, and co-folding with AlphaFold 3 or Boltz-2, out of 300+ integrated tools across 26 categories.
Numbers and geometry sit together. The distances come off the report; the angle that produced each one comes off the structure. Handing that result to colleagues who weren't in the session is a separate job, and what a modern molecular presentation looks like covers it.
Where Nanome fits next to other tools
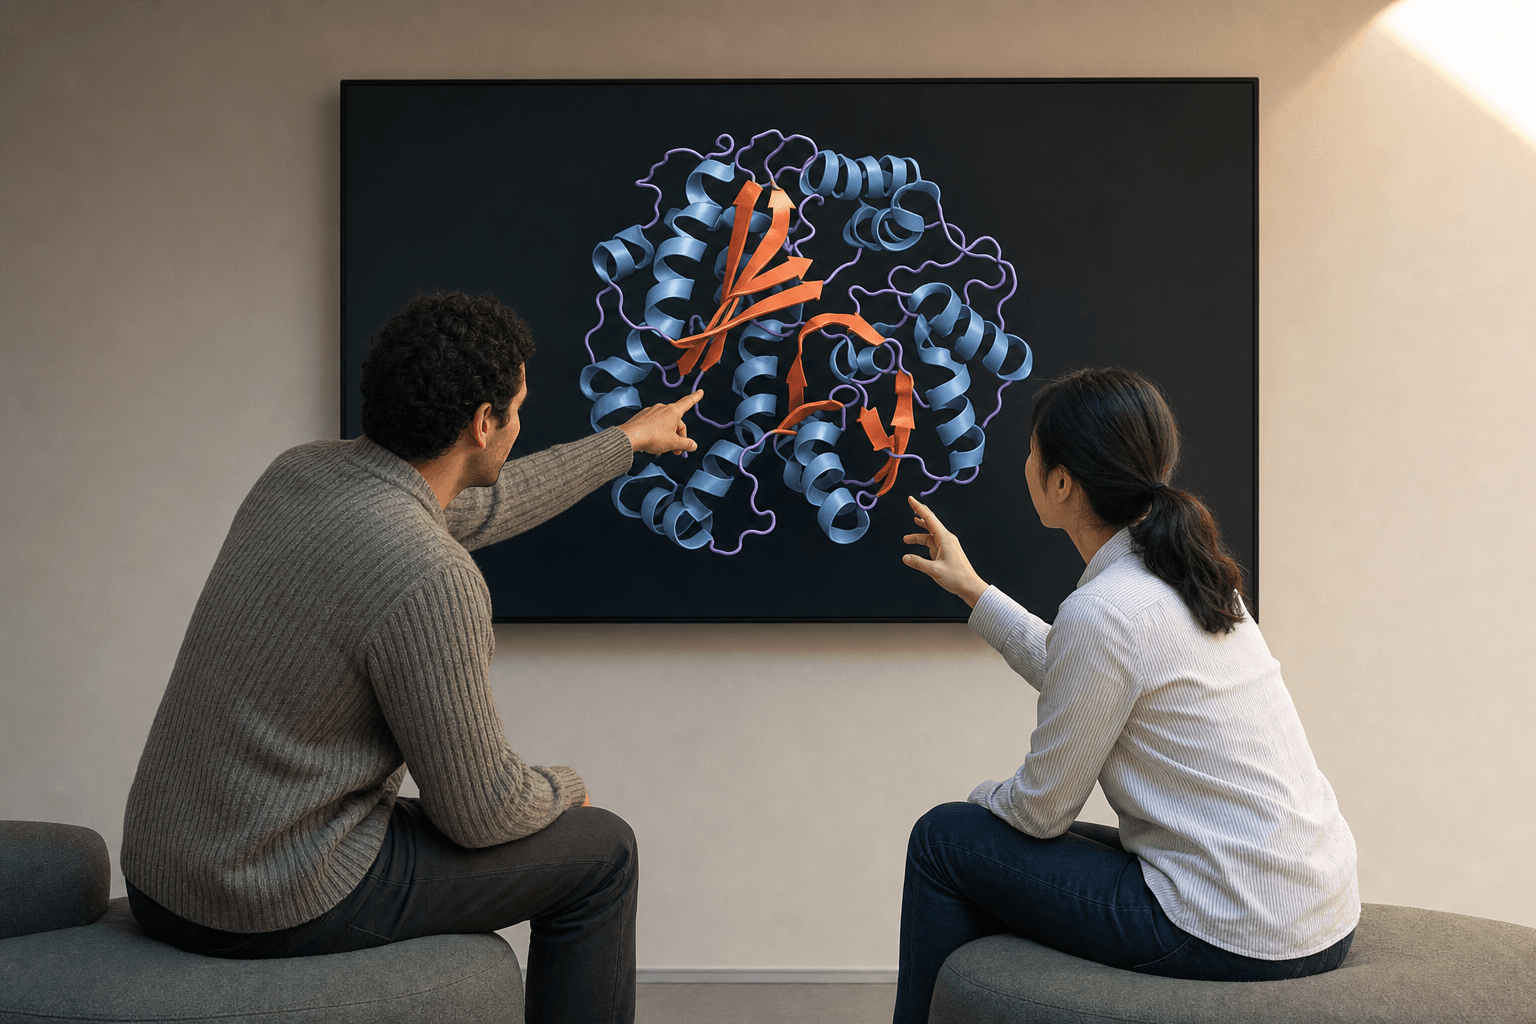 Two colleagues sit together pointing at a protein ribbon structure on a large display, collaborating on a molecular analysis.
PyMOL and UCSF ChimeraX draw contacts well and are the desktop standard, mostly single-user, driven by a GUI or a script. Schrödinger Maestro and MOE go deeper again, with contact analysis sitting inside a full comp-chem suite. Nanome's angle on the same pocket is a session several people join at once, native immersive 3D, and a copilot that runs the analysis from a plain-English request. It integrates with several of these suites (Schrödinger LiveDesign, MOE, Cresset Flare, OpenEye) rather than asking anyone to give them up.
Files move over without a conversion step. PyMOL .pse sessions and .moe files open for viewing, Maestro .mae and .maegz arrive through the LiveDesign gadget, and the ordinary structure files those suites write out load the same way. Those session formats are import only; molecules come back out as PDB, SDF or SMILES, one frame at a time. More on supported formats.
A binding pocket is a 3D object, and turning one over picks up what a single render angle buries. A hydrogen bond measuring 2.9 angstroms in a table can still sit at a useless angle. A clash tucked behind a side chain shows up the moment the structure turns. With two people inside the same structure, the argument about a pose happens on the atoms themselves, which is the working pattern collaborative drug discovery software for remote teams goes through. Groups have written up how they split that work at nanome.ai/case-studies.
For a batch pass over thousands of complexes where no single one gets a look, a headless PyMOL script or a MOE pipeline does the job with fewer moving parts. Nanome fits the other case: one pocket worth understanding, a group that needs to see it together, or a question that's quicker to ask in words than to script.
FAQ
How do I see hydrogen bonds in a protein-ligand complex?
Load the complex in Nanome, protonate it if the file arrived without hydrogens, then switch on interaction lines. Hydrogen bonds appear as colored dashes between donor and acceptor atoms. Rotating the pocket in 3D shows the angle as well as the distance, and a bad angle costs you affinity even when the distance looks fine.
Do I need a headset to analyze interactions?
No. The browser build runs with no headset at all, and there's a Windows desktop app. Headsets (Apple Vision Pro, HTC Vive Focus 3, Meta Quest, Pico Neo) add depth perception, which helps when a pocket is crowded, and the analysis itself is identical either way.
What files does Nanome load for this?
Structures come in as PDB and mmCIF, SDF, MOL and MOL2, XYZ, PQR, SMILES, and AutoDock .pdbqt (converted to PDB on load, with charges dropped, new in 2.6.0). Session files load for viewing: PyMOL .pse, .moe, and Maestro .mae / .maegz. An electrostatic map (.dx) overlays onto a structure already open. Export runs the other way as PDB, SDF or SMILES, single frame. More on supported formats.
Does MARA report interaction distances?
Yes. Ask it to analyze the interactions and it returns hydrogen bond distances, the hydrophobic contacts, and the pi-stacking pairs, along with the tools it called and what each one produced.