Communicating a computational result to an experimental team comes down to handing over the 3D object the calculation was about, along with the evidence behind it, so the people who run the next experiment can turn it and ask their own questions. Nanome is a collaborative molecular visualization and drug discovery platform that covers that handoff. It plays back molecular dynamics trajectories frame by frame, saves 3D views of a structure as scenes, and hosts shared sessions colleagues join from a browser tab or a headset. MARA, the AI copilot inside it, runs the analysis when a question lands mid-discussion, so the number and the molecule arrive together.
Most results travel as a plot, a slide and a paragraph of interpretation, and for plenty of results that's the right form. The ones that suffer are the results whose content is a shape.
Where a computational result loses people
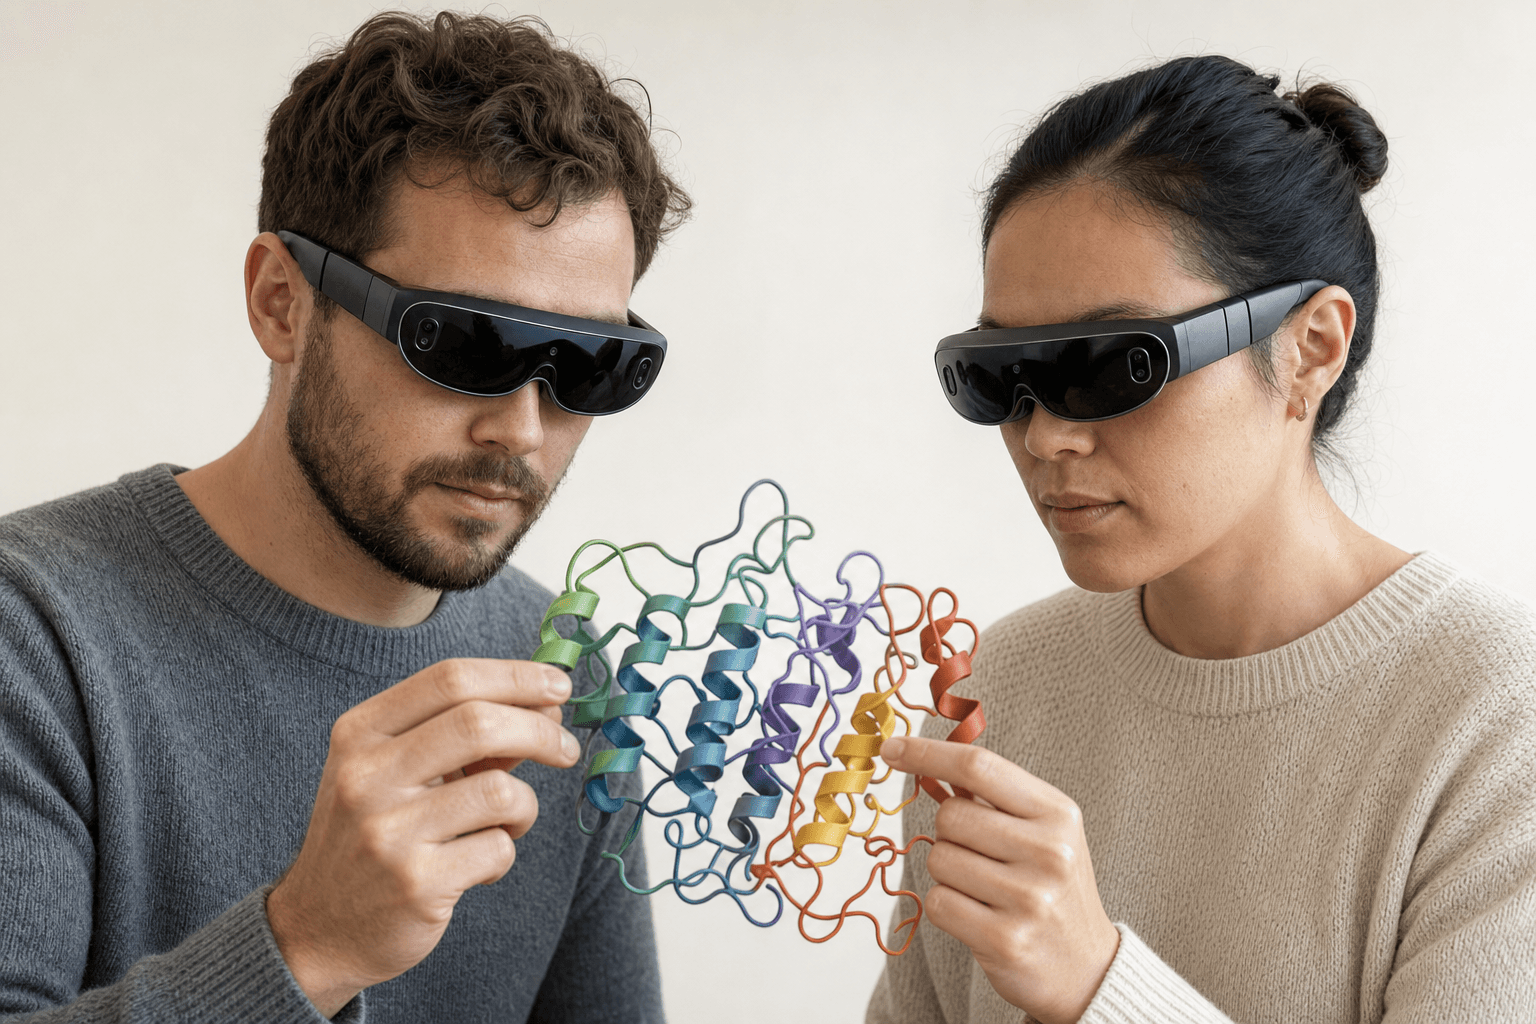 Two colleagues wearing ultra-thin VR headsets examine the same ribbon-cartoon protein structure floating between them
A simulation is a 3D object moving through time. A figure of it is a photograph, taken from one camera angle, picked before anyone in the room had asked a question.
For a quantity, that works out fine. For a geometry, it gets expensive. Somebody who wants to know what the pocket looks like from behind the ligand, or whether 2 aggregates differ in shape or only in size, is asking for a different photograph, and producing one means going back to the workstation and finding another hour on 2 calendars.
The people on either side of that handoff have spent their hours differently. Whoever ran the simulation has turned the system over hundreds of times and knows what each projection drops. Whoever runs the next experiment is meeting the object for the first time in that one figure, and the detail a projection drops is often the detail the experiment turns on.
What survives the trip, and what flattens
Some results lose almost nothing on the way to a flat page. Others lose the part that made them worth the compute.
| Result | What the 2D version carries | What the 3D version adds |
|---|---|---|
| A docked pose | An interaction diagram with contacts drawn as dashes, plus a render from one camera angle | The pocket at true depth, where a clash reads as a clash and an H-bond angle can be checked from either side |
| An MD trajectory | RMSD or a distance plotted against time, with a handful of representative snapshots | The motion itself, frame by frame, with the loop or the ligand moving in front of the group |
| An aggregation or packing difference | A cross-section and a radial distribution function, both framed before the question came up | The assembly turned over in the hand, where a closed cluster and a stacked layer separate on sight |
| A chain interface | Buried surface area as a number, plus a contact map | The shape of the interface, and which residues actually sit across from which |
| A conformational change | 2 overlaid ribbons, or a morph rendered along one camera path | Both states held side by side and rotated together, at the scale the change happens on |
| RMSD over the course of a run | A line, which is what the quantity is | Very little. The 3D view comes in afterwards, once a spike names a frame worth opening |
That last row belongs there as much as the other 5. RMSD against a reference frame is a scalar moving along one axis, and a line is the right way to draw it.
How teams do it





| How the result travels | Strongest at | What the audience can do with it |
|---|---|---|
| GROMACS or MDAnalysis analysis plus a plot | Numbers that are reproducible, scriptable and ready for a manuscript | Reading the value and checking the axes. A question about a different frame goes back into the run queue |
| A VMD movie | Smooth playback of very large systems, scripted and repeatable | Watching the camera path the author picked, at the pace the author picked |
| A PyMOL session | Representations, selections and saved views preserved in one file | Opening it and turning the structure, for anyone who owns PyMOL |
| A slide deck | Travels anywhere, archives cleanly, opens on any laptop | Following the argument. Each structure stays the photograph it was exported as |
| Nanome scenes in a shared session | Saved 3D views of the live structure, walked through together on the web or in a headset | Turning the molecule from their own angle, and getting a number back from MARA without leaving the view |
The first 4 rows all end in one place: the audience receives a rendering of a decision that was made in 3D somewhere else.
Where Nanome fits
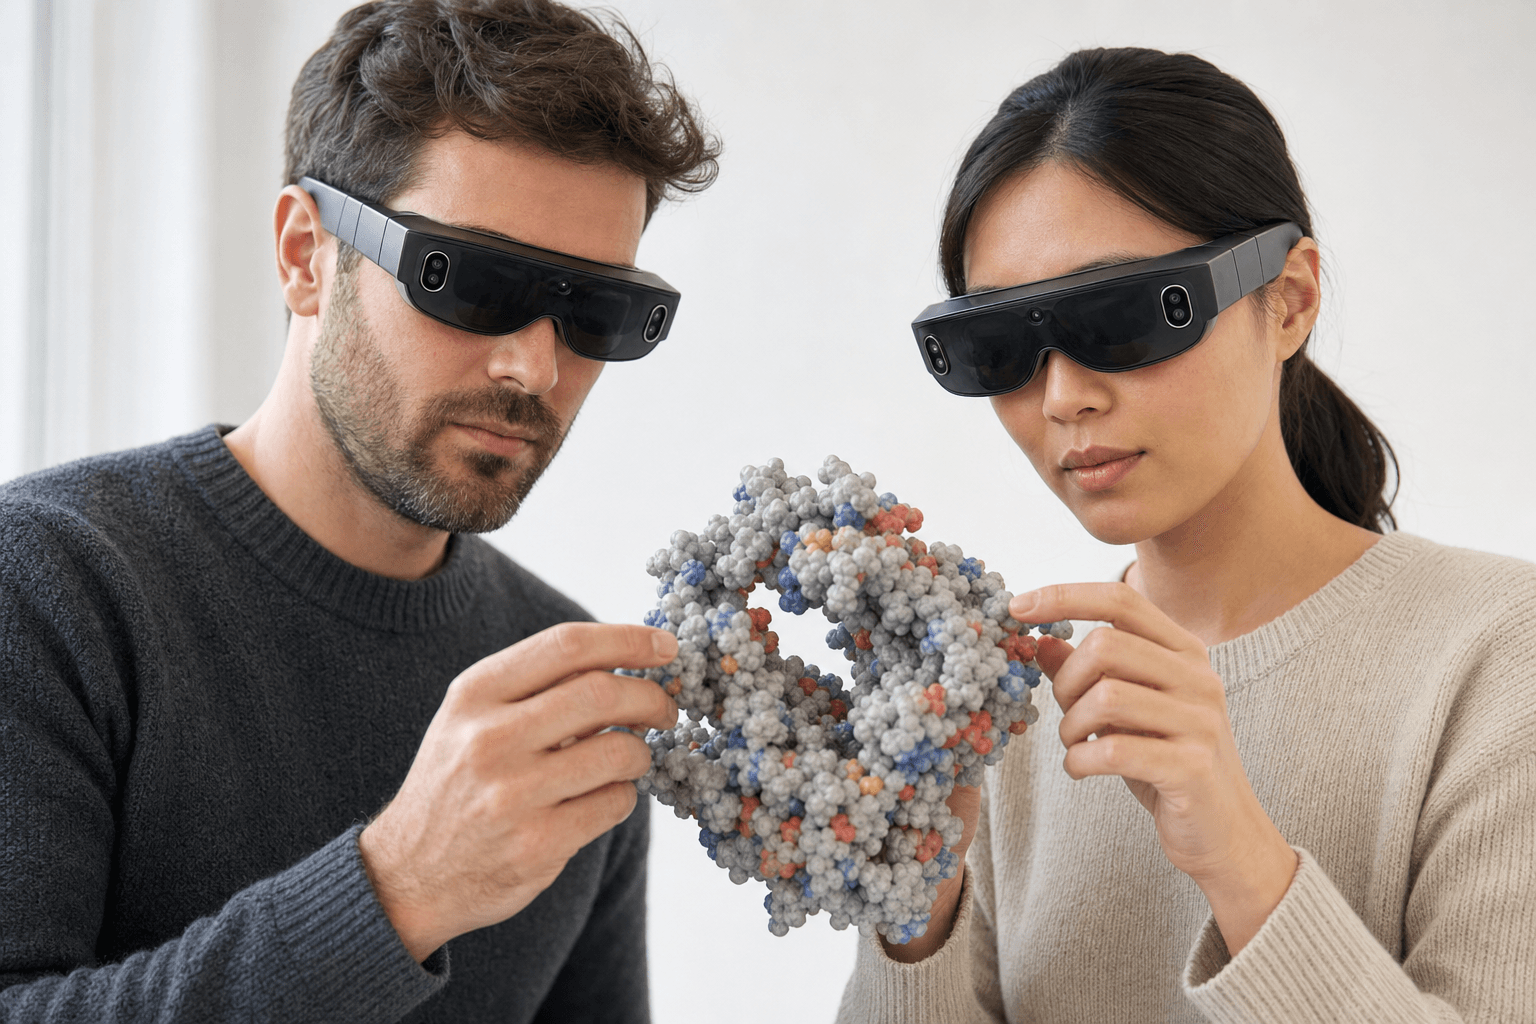 Two colleagues wearing ultra-thin VR headsets examine the same space-filling protein model floating between them
Trajectory playback shipped in Nanome 2.5. A run opens in the workspace and steps frame by frame in a browser tab, on Windows, or in a headset, and a session holds more than one person, so the computational scientist and the bench scientist watch the same frames at the same moment from wherever they each are. Trajectory playback docs.
Scenes give the argument a running order. A scene is a saved 3D view of the real structure carrying its own point of view, representations and labels, and scenes sit in a sequence the way slides do, reorderable by dragging. Scenes docs. Everyone opens on the same view, and from there each person can turn the molecule and study the part they came for. That is the request a flat figure has to send back to the workstation.
Questions that arrive mid-discussion go to MARA. RMSD across the run, the distance between 2 atoms over time, a representative frame from the energy minima: the answer lands on the structure the group is already looking at, labeled with the tool that produced it and the inputs it ran on, so whoever asked can retrace it later.
One limit belongs in the open. Surfaces are disabled during trajectory playback, because recomputing a molecular surface at every frame costs too much to hold a steady frame rate today. A run plays back as ribbon, stick or space-filling, and the surface returns the moment playback stops.
Resonac's computational and experimental groups worked in parallel for close to 2 years while the molecular dynamics evidence lived in trajectories and 2D plots. The simulations covered roughly 200 APPS molecules in 150,000 waters: lauryl alcohol packed into micelle-like clusters, while behenyl alcohol drove layered lamellar structures. On a flat plot those 2 arrangements are hard to tell apart. The 2 groups then stepped through the same GROMACS trajectories together in 3D, and aligned within a few hours.
Separately, an experimental iteration cycle at Resonac that had taken 6 months came down to roughly 2 to 3 days. The write-up sits with the others at nanome.ai/case-studies.
Related questions have their own pages. Software for visualizing molecular dynamics trajectories compares the viewers side by side. How a set of scenes gets built and handed on is the subject of what a modern molecular presentation looks like. When the 2 groups sit in different time zones, collaborative drug discovery software for remote teams covers how a live session runs across sites.
When a plot is the right answer
A lot of computational output is one-dimensional, and drawing it in 3D adds nothing.
RMSD over time is a line. So is a distance between 2 atoms, a free energy along a reaction coordinate, a potency series, an ADMET table. When the content of a result is a number moving along one axis, a plot states it exactly.
A manuscript figure, a regulatory submission and a summary slide in a board deck all want one fixed image that will look the same in 10 years. For a rendered movie with a scripted camera, ChimeraX has a genuine movie command and decades of rendering work behind it, while VMD and PyMOL still turn out the stills that hold up in print.
For a public structure that simply has to reach somebody, a Mol* viewer embedded in a page or a wiki wins outright. The recipient clicks a link, the structure loads in their browser, and no account and no software sit in the way. RCSB PDB serves Mol* on every entry page, which covers a large share of "can you show me this protein" traffic, at zero cost.
Nanome is the pick when the content of the result is a shape or a motion, when the people who have to act on it need to look from their own angle, and when the follow-up question deserves an answer while everyone is still in the room.
FAQ
How do you explain molecular dynamics results to someone who doesn't run simulations?
Leading with the physical picture and keeping the numbers beside it tends to travel furthest. The motion is the finding, so a trajectory that actually plays, with the loop or the ligand moving, carries an audience further than a plot introduced first. In Nanome that means opening the run in a shared session, stepping the frames together, and asking MARA for the RMSD or the distance that puts a number under what everyone just watched.
What trajectory formats can be reviewed in 3D?
A GROMACS .gro file loads on its own. Frames in .xtc, .trr and .dcd attach to a model that is already open, and their atom count has to equal that model's. All 4 run on the frame-trajectory path, which tops out at a 2000-frame ceiling per model, and 64-bit CHARMM DCD and fixed-atom DCD fall outside it. More on supported formats.
Does everyone need a headset to review a trajectory together?
No. The browser web app runs in a tab with nothing to install, and there's a Windows desktop build as well. Someone in a browser stands in the same session as a colleague in a Meta Quest, Apple Vision Pro, Pico Neo or HTC Vive Focus 3, watching the same frames. Headsets carry depth and scale a monitor can't, and the browser puts everybody else in the discussion.
How long does it take to set up a review like this?
The prep has the same shape as building slides. The trajectory or the structure loads into the workspace, a scene gets saved at each view the discussion needs, and the scenes get dragged into the order the argument runs in. Whoever is joining opens a link in a browser. The step that usually eats the time, converting a file so the other side can open it, drops out once both sides are in the same workspace.