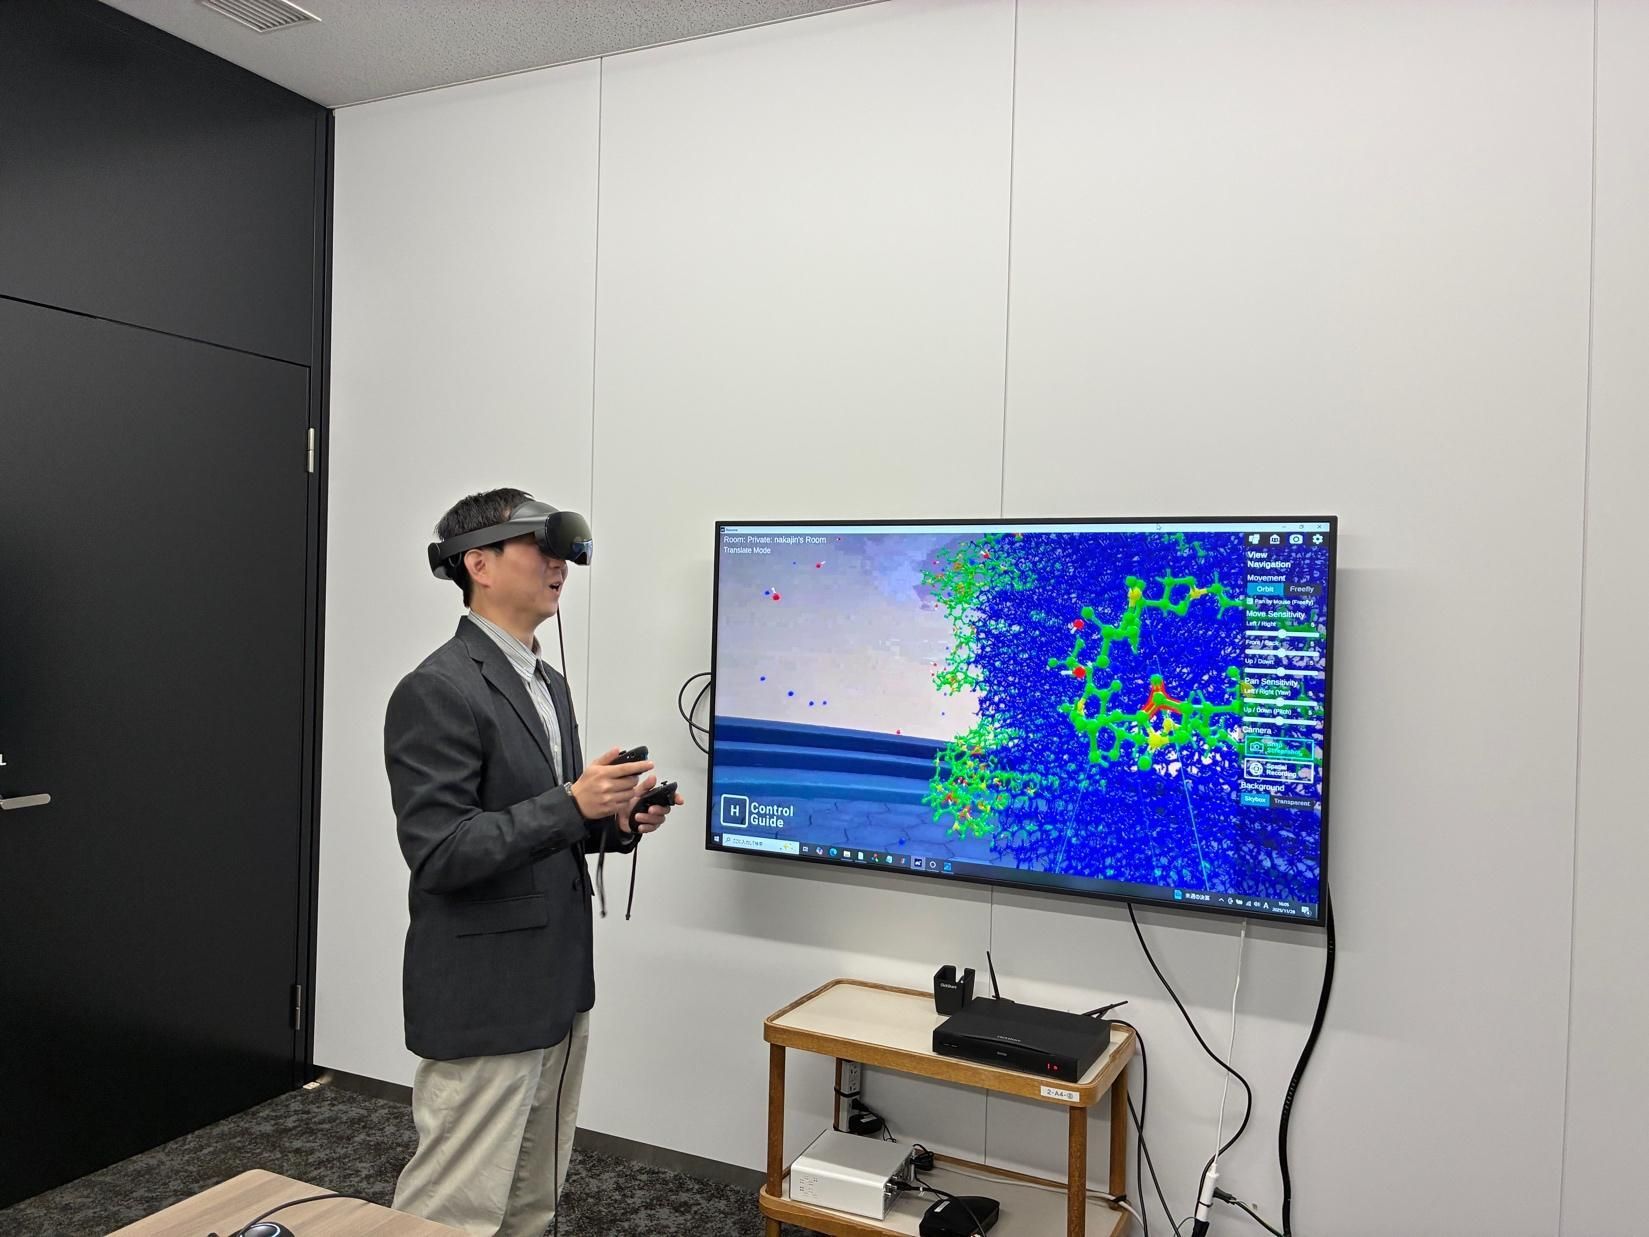
Resonac's computational chemists found a plausible molecular explanation for why some additives stabilize a vitamin C derivative better than others. Getting that result into the lab took nearly 2 years, and the holdup was the format the evidence came in: trajectory files and 2D plots, when what the experimental team needed was to see the structures for themselves. Once both teams could look at the same molecules in three dimensions, a 6-month experimental cycle came down to 2 to 3 days.
Two teams, two kinds of evidence
In most R&D organizations, computational and experimental chemists use different tools and think in different terms. Computational chemists work in trajectories, energy landscapes, and numerical predictions. Experimental chemists work in flasks and assays, and they trust what they can observe. Both groups are rigorous. They're just looking at the same science from different sides, and a result that is conclusive on one side can look abstract on the other.
Resonac's teams sat on either side of that line.
The science
The project was a stability problem. Resonac was looking for additives that improve the stability of Trisodium Ascorbyl Palmitate Phosphate (APPS), a vitamin C derivative used in cosmetic formulations. APPS is designed to improve the bioavailability of vitamin C, but its ester bonds can hydrolyze in aqueous solution. The usual answer is a stabilizing agent. Why some stabilizers work better than others hasn't been well understood at the molecular level, so historically the search for a good one has leaned heavily on empirical testing and formulator intuition.
The computational team set out to change that. Using GROMACS with the GAFF2 force field, they ran molecular dynamics simulations of APPS in aqueous solution with dozens of candidate stabilizers. Of those, 5 appear in this article: ethanol, hexanol, lauryl alcohol, cetanol, and behenyl alcohol. Each system held roughly 200 APPS molecules, 150,000 water molecules, counterions, and the candidate additive, all at concentrations matching real formulation conditions. Charge distributions were calculated in Gaussian16 at the HF/6-31+g(d) level before the dynamics runs began.
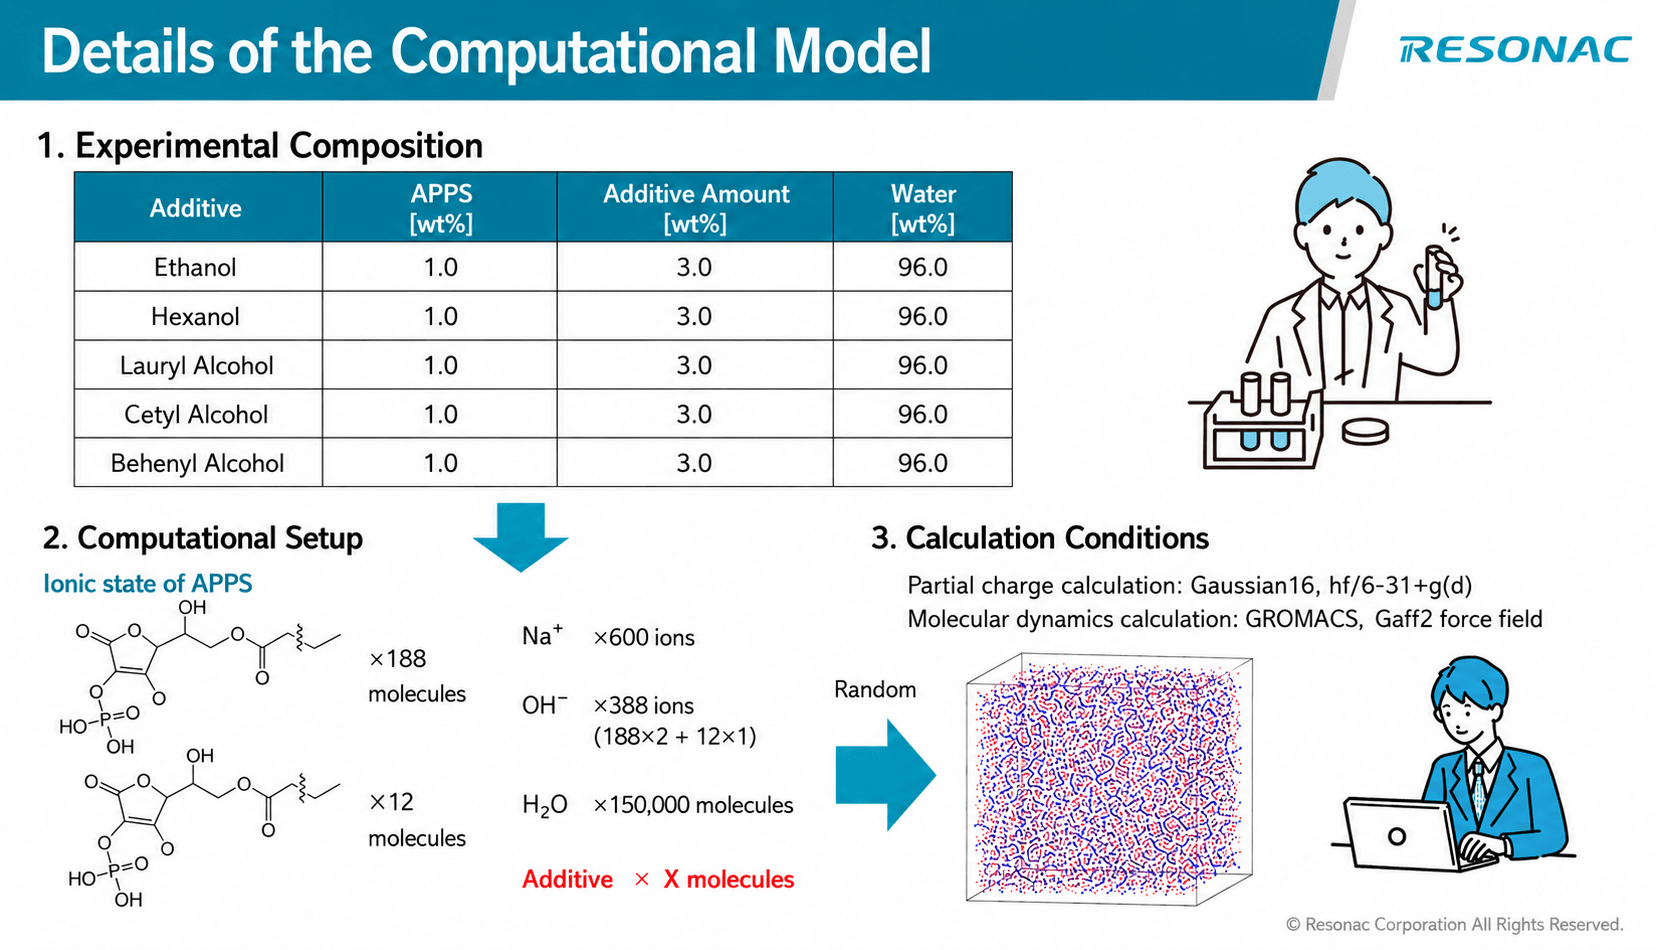
Pictured: Resonac's molecular dynamics simulation setup. The table (top left) shows the 5 alcohol additives tested alongside APPS in aqueous solution at formulation-relevant concentrations. Below, the molecular structures and system composition used in the GROMACS simulations: ~200 APPS molecules, 150,000 water molecules, counterions, and the candidate additive. Figure courtesy of Resonac Corporation.
Each system went through a multi-stage equilibration protocol: overlap removal, then NVT and NPT relaxation, then production runs at realistic temperature and pressure. The trajectories showed that different additives produced structurally distinct outcomes. Lauryl alcohol gathered around APPS into micelle-like structures, with the additive and APPS clustered together and water excluded from the interior. Behenyl alcohol drove the formation of layered lamellar structures instead, a different packing arrangement altogether. Shorter-chain alcohols such as ethanol produced far less organized aggregation.
Those structures point to a mechanism. A tightly packed micelle buries the ester bonds inside it, away from water, which should slow hydrolysis. A loose, disorganized cluster leaves them exposed. That gave the computational team a working explanation, at the molecular level, for performance differences that had only ever been observed empirically, and a pointer to which structural features to optimize in future additive candidates.
The structural result was clear in the data. Getting it across to the experimental team was the hard part. The evidence lived in trajectories, energy calculations, and 2D projections of something inherently three-dimensional. The format was precise, and it left out the spatial reality of what was happening at the molecular level. Put a micelle and a lamellar phase side by side in 3D and the difference is obvious at a glance. Reduce them to plots and cross-sections and it disappears.
The experimental team had good reason to be careful. Redirecting a lab program on simulation output alone carries real risk, and the evidence they'd been handed was a set of plots and trajectory files. So they kept to their established approach, and for nearly 2 years the two groups worked in parallel: the computational side confident in its predictions, the experimental side waiting for evidence in a form that matched its own intuition.
What changed
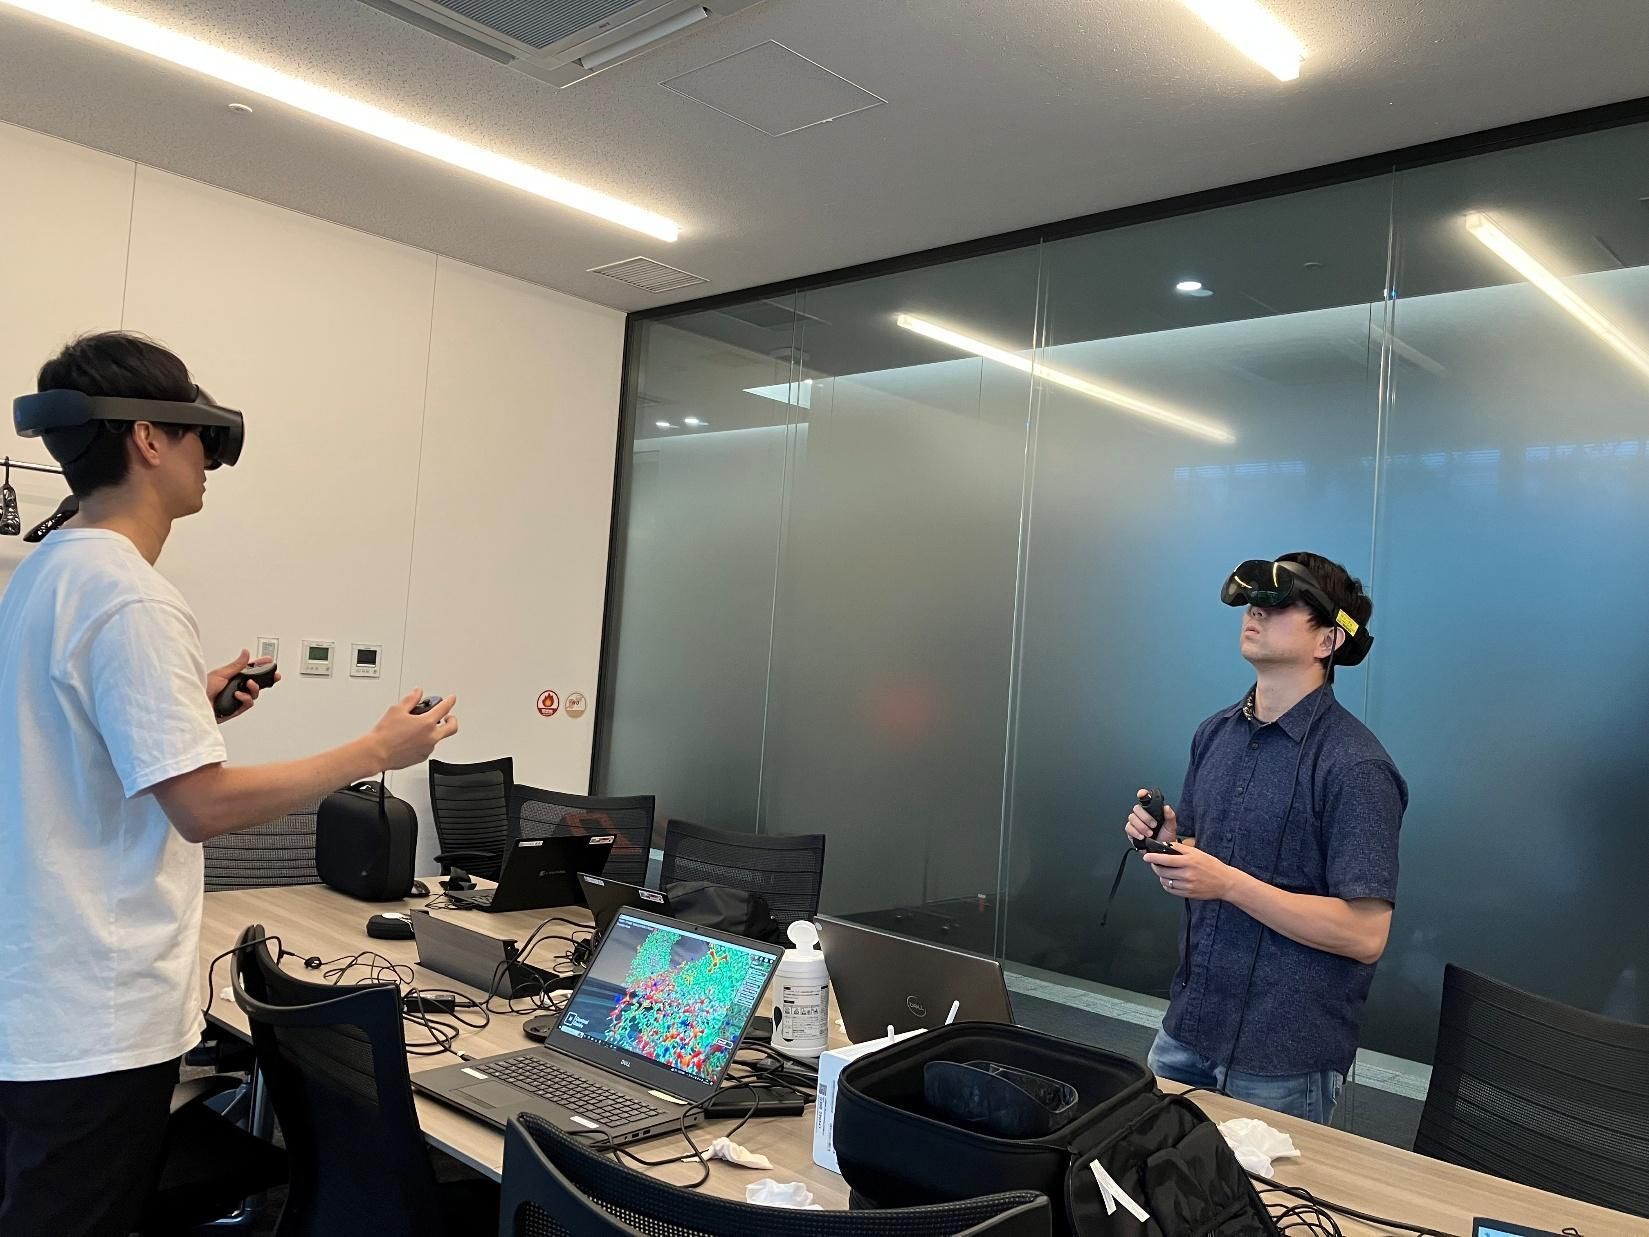
Pictured: Resonac's computational and experimental teams reviewing molecular dynamics trajectories together in Nanome. Photo courtesy of Resonac Corporation.
Resonac's computational team loaded the trajectories into Nanome and set up a joint review session with the experimental team.
The data that had lived in spreadsheets and 2D plots was now something both teams could explore together in three dimensions. The aggregation the simulations had predicted was there in front of them: molecules clustering, packing together, forming structures that would crash out of solution. The experimental chemists could rotate the system, zoom in on the regions in question, and build their own spatial intuition for what the simulations were showing.
Within a few hours the two teams were aligned. The experimental team could see what the computational team had been flagging, and they had the context to act on it with confidence. They adjusted their experimental approach, and the results validated the computational predictions.
The results
The measurable result first. An experimental iteration cycle that had taken about 6 months now takes roughly 2 to 3 days. Molecular dynamics plus a live, shared review in Nanome cut out the back-and-forth that usually stretches discovery timelines.
The bigger result is harder to put a number on. A communication gap that had held for 2 years closed in a single afternoon, with both groups looking at the same rotating structure and building one shared picture of the chemistry.
Why this matters beyond Resonac
Most pharma and materials science companies have a version of this gap. Computational teams produce outputs that are numerically precise and spatially abstract. Experimental teams want physical intuition before they change course, which is exactly the rigor you want from the people running your experiments. Tables and 2D projections strip out the spatial context chemists use to make decisions, and that context is the part that has to travel between the two groups.
The trajectories Resonac's teams reviewed that afternoon were the same ones the computational group had been working from all along. Seeing them together, in three dimensions, is what moved the project. Nearly 2 years of parallel work came together in a few hours.
Resonac is a global chemical and materials company headquartered in Tokyo. Their R&D teams use Nanome to bridge computational and experimental workflows through collaborative 3D molecular visualization.
Nanome is a collaborative platform for 3D molecular visualization, available on web and XR. Teams use it to review computational results, annotate structures, and make faster decisions together.